
Across the tiers
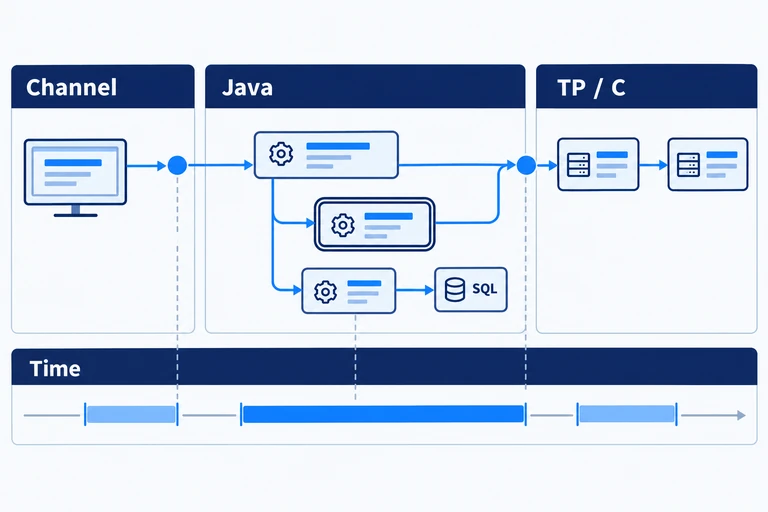
One transaction passes through channel, integration, core and TP tiers, and each tier keeps its own record. Correlating those records into one request is manual work.
Relate transaction paths to performance information when investigating banking application behaviour.
Supported agents and products determine coverage across web, Java application servers, TP monitors and C applications.
One transaction passes through channel, integration, core and TP tiers, and each tier keeps its own record. Correlating those records into one request is manual work.
On salary days and campaign days, volume rises and the first symptom is a slow response rather than a failing component. Individual systems can look healthy while a business transaction is slowing down.
There are hundreds of application instances and only a few people watching them. A JVM problem usually shows up as slowness, with the cause in garbage collection, a thread pool or a connection pool that a server dashboard does not show.
Core business often still runs on TP monitors and C applications, where Java-side tooling does not reach. Queue state, call relationships and process resources on that side tend to sit with a different team and a different tool.
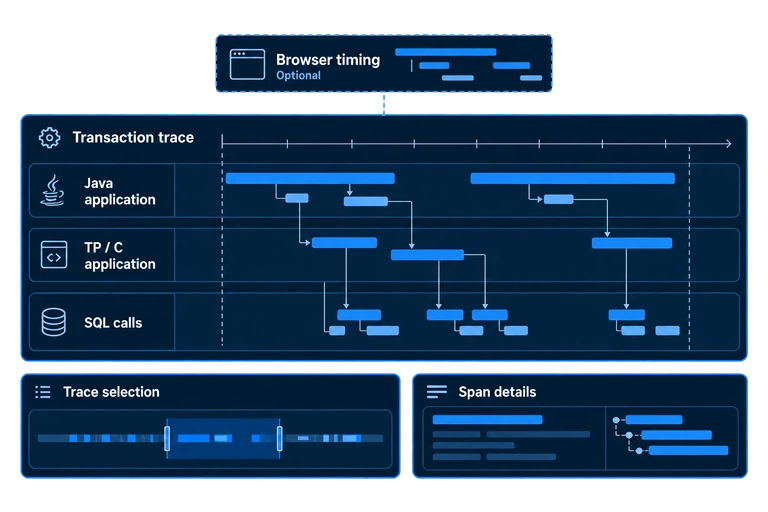
Follow the linked call path to see where method and SQL processing time accumulates.
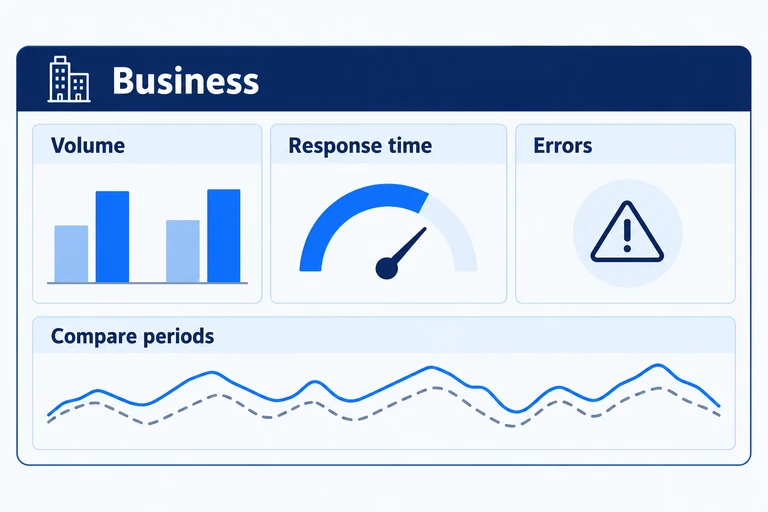
Review transaction volume, response times and errors by business, and compare the same hours across dates.
Business views require transaction-code and business-name mapping during implementation.
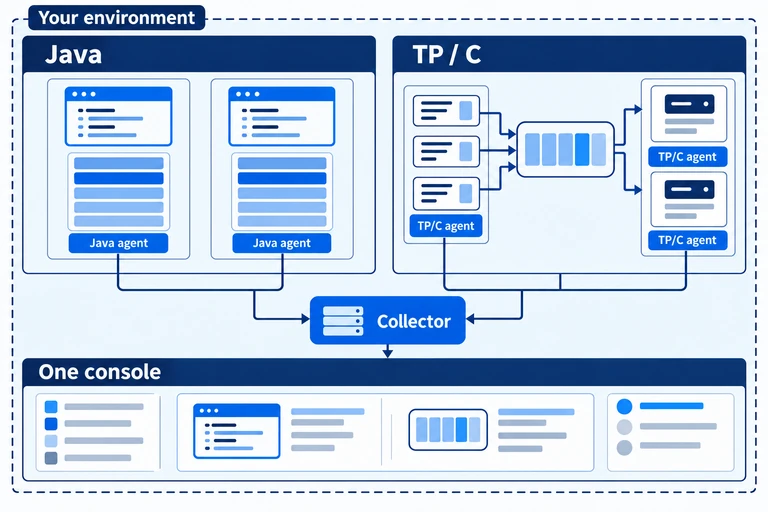
View application instances alongside TP/C services, with resource usage, queue states and call relationships in one console.
TP monitoring uses a separate agent for Tuxedo or Tmax; custom-function coverage is confirmed during implementation.
Use threshold and historical-baseline events to find related transactions and investigate their call trees.
Historical comparisons need accumulated data. Notifications use your organisation’s configured channels.
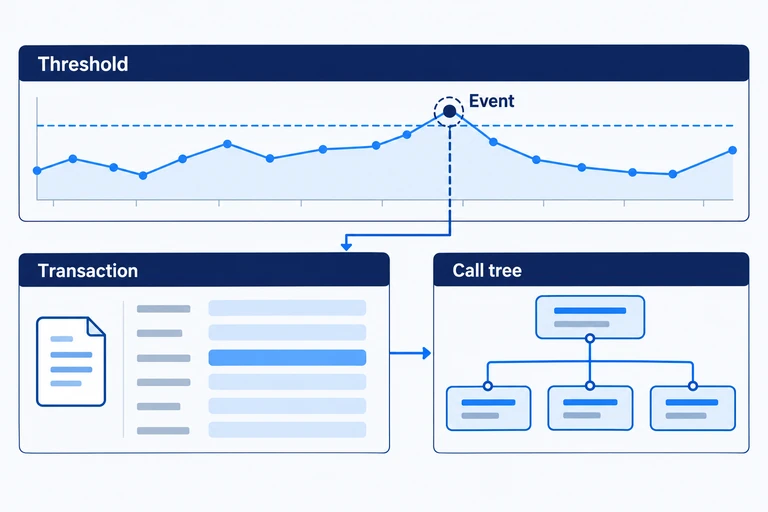
Search transaction history by period, response-time range, transaction identifier, transaction code and business group, then open the one that slowed down or failed.
The execution path across nodes is linked into one call tree showing method and SQL time in each tier, together with the message details the transaction carried: channel code, response code, response message and argument values. SQL inside the transaction shows session, elapsed time, result details, bind variables, execution plan and lock waits.
Linking requires the matching agent on each tier. Database performance events outside the transaction path come from a separate DPM product.
Answer "was this business slower yesterday, and did it fail more often" without switching to a machine view.
Nine metrics per business: throughput, transactions per second, transactions in progress, peak in progress, average and maximum response time, successful transactions, business errors and general errors. Per-tier statistics for the same business, Top-N lists by success count, response time or error count, an hourly comparison against another date, and daily, weekly or monthly reports exported to HTML, Excel or PDF.
Business grouping depends on mapping transaction codes to transaction names and business classification codes to business names during implementation. Without that mapping only transaction-level views exist.
Watch many application instances at once, drill into the one in trouble, and read the TP or C estate next to it.
For Java application servers: instance state on one screen, heap and non-heap usage with trends, garbage collection time and counts, connection pool usage, threads with dumps, open files and sockets, and JMS queue or web session metrics where those components exist. For the TP monitor and C applications: caller–callee invocation counts, errors and response times; queue status sampled at short intervals with the busiest period and the longest waits; per-node service load and Top-N lists for a chosen day and time window; delayed-service distribution in configurable bands; process CPU and memory by PID over time; and TP logs readable without opening a console session.
The TP side requires its own agent and covers Tuxedo or Tmax. Monitoring coverage for custom functions is confirmed during implementation. The number of instances visible on one screen depends on display and resolution and is not a capacity limit.
Let rules decide what deserves attention, and return to the console only when judgement is needed.
Threshold events on predefined monitored items, and statistical events at one-minute, ten-minute, one-hour and one-day intervals compared with the historical average for the same interval, covering response time, volume rising or falling, error and failure counts, and error and failure rates. Events carry warning or critical severity, lead to the related transactions and their call tree, and can be notified through SMS or email, with an interface for external systems.
Thresholds, intervals and baselines are configured per business and per deployment. Statistical comparison needs historical data to accumulate. Notification uses the channels your organisation already operates. Application Monitoring supports detection, analysis and notification within your operations workflow.
Browser-side timing is an optional package. It shows per-action summaries, a resource waterfall where an XHR opens the server-side call tree, and daily or hourly statistics split between server and browser time. It requires a collection script on the web server and its reference in the application's common pages.
Application Monitoring brings application and transaction performance into view alongside the operational tools you already run. It attaches to your applications and follows the transaction path they take.
Coverage follows the application and transaction path: web server, Java application server, TP monitor and C applications, and the browser as an optional package. Database-side detail beyond that path comes from a separate DPM product, and the optional SpaceMon linkage adds database events and statistics.
On-premises deployment
Agents collect performance information from supported application environments and report to a collector that runs in your environment. The console reads from the collector; statistics and raw data stay in your own databases. The product is delivered as the ENPHAROS family.
Java applications and C or TP services are instrumented without changing application source or the build. Attaching an agent is still deployment work: the agent is installed, the way the process starts is adjusted, and that process is restarted. Installation and day-to-day operation are agreed with your team in the project.
Browser-side timing is an optional package. It needs a collection script on the web server and a reference to that script in the application's common pages, with target clients selectable.
Some of what the page describes depends on work done during implementation: mapping transaction codes to business names, setting thresholds and comparison baselines for events, and access to the systems the agents read. Deployment scope, compatibility and collector sizing are confirmed for the target environment rather than assumed.
Application Monitoring supports detection, analysis and notification within your operations workflow.

Application and transaction monitoring across banking systems
Shinhan Bank used ENPHAROS JAVA to monitor application servers, databases and operating systems across core banking, external systems and customer channels, including end-to-end transaction monitoring.
Between 2021 and 2024 the product was deployed in 15 projects, most of them in financial services.
Tell us about your application environment, the transactions you need to follow and the performance issues your teams want to understand.